
about $1.3 below the pink cross as of yesterday.
The Max Pain Zone continues to move downward today, to 48.84 +/- 1.22.
Wednesday, January 9, 2008
Tuesday, January 8, 2008
Nasdaq action puts in South of the Pink Cross
area, even as the crosses themselves continue to migrate downward. Can we call this area the "oversold" area?

Monday, January 7, 2008
Friday, January 4, 2008
GOOG January Target
GOOG's Max Pain Zone for January Options is: 627.74 +/- 17.79.
QQQQ action catching up to pink cross area:
QQQQ action catching up to pink cross area:

Thursday, January 3, 2008
Tuesday, January 1, 2008
Max Pain Zone?
Looking at the graph on last night's blog, I was thinking perhaps instead of "Max Pain Point", we should think about "Max Paint Zone". The top of the graph was a bit flat and the price should be able to move a little bit to the left or right without too much of an impact.
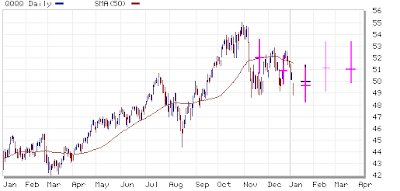
But how much of an impact is "not too much"? We can only guess. What about $30 million? That sounded like chicken change to our option writers, right? Let's see how far can the QQQQ price deviate from the max pain point if we allow for $30m allowance one way or another.

The above graph is a recent QQQQ chart with the "Max Pain Zone" of the last and coming few months painted in. The horizontal line of the pink crosses refers to each month's max paint points, while the vertical line covers the max pain zone if we allow for $30m freedom.
For December, the price action was well within the range of the pink cross. For November, the price closed below the cross (I think the option writers made $70m less money that month). However, being able to see the cross way down there as early as late October should have been useful.
For January, the cross is also "way down there".
(BTW, I drew a thin cross for Feb., but because of the slight volume, the Feb cross should be taken with a grain of salt.)
But how much of an impact is "not too much"? We can only guess. What about $30 million? That sounded like chicken change to our option writers, right? Let's see how far can the QQQQ price deviate from the max pain point if we allow for $30m allowance one way or another.
The above graph is a recent QQQQ chart with the "Max Pain Zone" of the last and coming few months painted in. The horizontal line of the pink crosses refers to each month's max paint points, while the vertical line covers the max pain zone if we allow for $30m freedom.
For December, the price action was well within the range of the pink cross. For November, the price closed below the cross (I think the option writers made $70m less money that month). However, being able to see the cross way down there as early as late October should have been useful.
For January, the cross is also "way down there".
(BTW, I drew a thin cross for Feb., but because of the slight volume, the Feb cross should be taken with a grain of salt.)
January Max Pain Target has floated up
a little bit, to 49.97 today.

See the attached graph above: the blue dots are the actual plots of the amount of QQQQ put & call contracts that will be in the money at each hypothetical QQQQ closing price point on Jan 18, that is the amount of money the option writers will need to pay option buyers (each unit equals $100 million), based on today's open interest numbers.
The premise is that the institutions that sold those options would prefer to pay out as little as possible, so they have a preferred range for the QQQQ price to fall on at option expiration day. Since these institutions are amongst the most powerful market participants, they frequently get what they wish for.
The pink line is a plot of the following mathematical model:
y = -4.86 - 0.145 (x - 49.97) ^1.810
whereas:
a = 49.97 : the max-pain point, the price point that is least painful (most profitable) for option writers, and most painful for option buyers;
b = -4.86 : amount in the money at the max-pain point;
c = 0.145 : extra amount of pain when price move $1 in either direction, roughly correspond to amount of put and call contracts with strike near the max-pain point;
d = 1.810 : a measure of the degree of concentration of contracts around the max pain point; how fast will the pain grows exponentially for the option writers as price deviate from the max pain point.
The volume for Feb contracts are still light, however, for March contracts, there has been quite a few contracts on the put side. This gives a max pain number of 51.01 for March contracts -- however, because the call side volume is light, this number is quite tentative for now and subject to revision.
Subscribe to:
Comments (Atom)